Key benefits of building with Mapbox
- Mapbox Vector tiles and Raster tiles enable The New York Times to seamlessly create data visualizations
- Mapbox GL JS animates complex data, providing readers with an immersive, in-depth exploration experience
- The Mapbox Geocoding API ensures precise mapping, enhancing the credibility of data visualizations
products used
Base Maps
Mapbox GL JS
Search
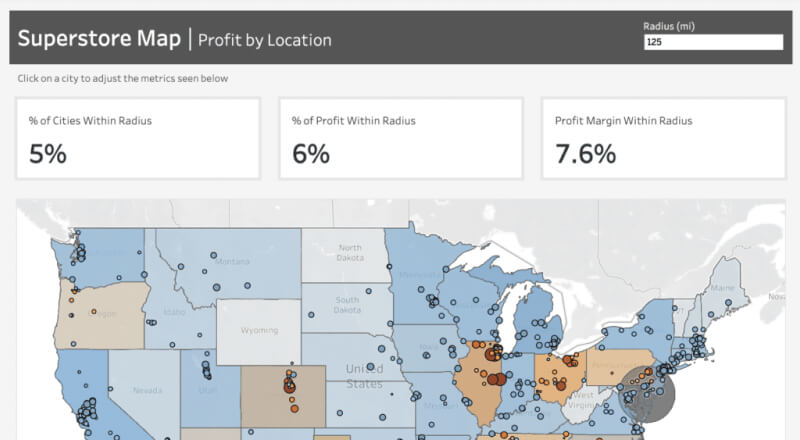
Election monitoring. Hurricanes. Urban planning. The New York Times maps are a canvas for society to understand the most pressing issues facing the world today.
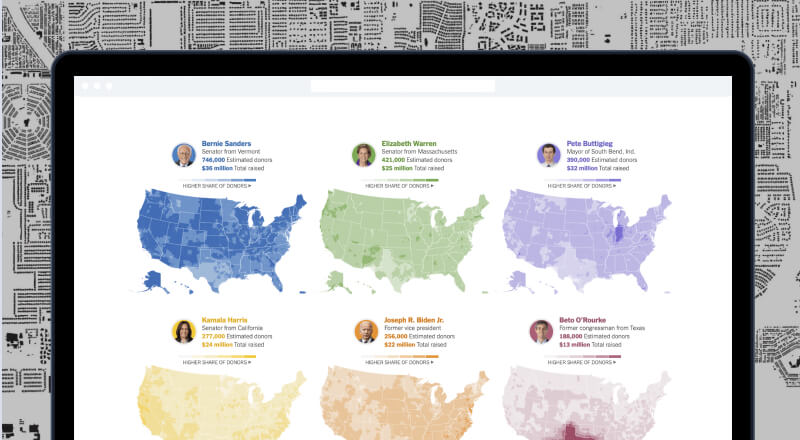
The Graphics Desk turns massive datasets into a engaging art-like interactive of Every Building America, to live mapping elections to see shifts in voting patterns, to tracking 2,278,000 individual donations to 2020 Democratic primary candidates their team creates immersive and interactive experiences that bring stories to life.
The New York Times is at the forefront of data journalism and interactive storytelling. We’re proud to be a part of that.