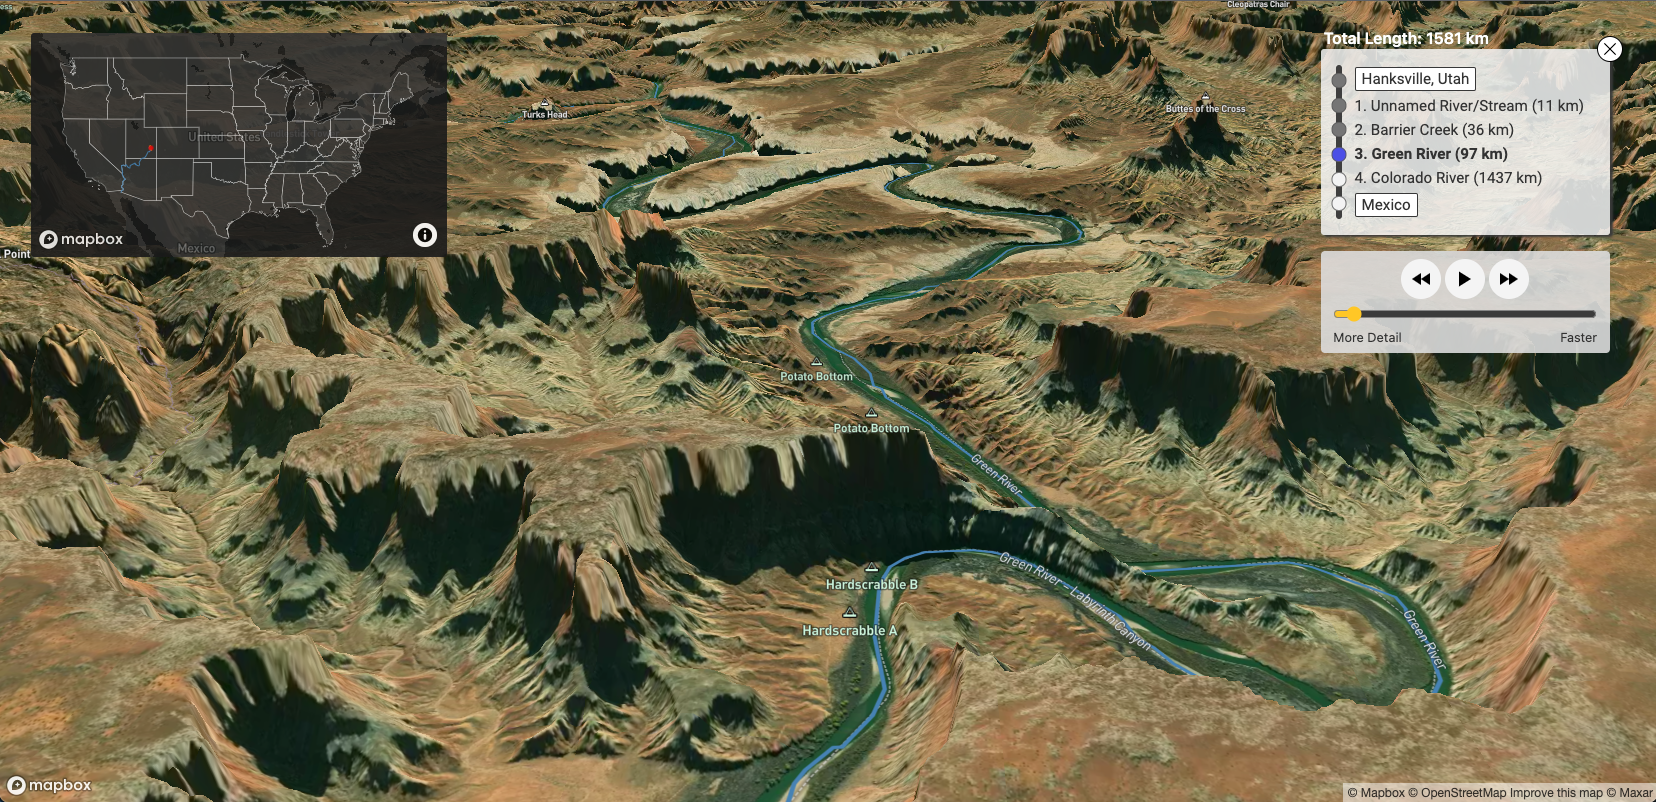
We were blown away by the River Runner map built by Sam Learner this summer - so we asked Sam if he would share more about how he built this immersive 3D experience.
Did you know that two raindrops falling inches apart can end up thousands of miles away from each other? Fascinated by how this happens, I dove into hydrology and watershed data to visualize the diverging paths of those two raindrops.
Routing a raindrop
Thanks to some incredible work by the water data team at the USGS, it’s possible to track flow patterns through any creek, stream, or river in the United States. This inspired a new vision for the project: what if people could trace how water from their backyard gets to the ocean? And could visualizing all of the watersheds and communities your water flows through help clarify the impact that our actions have on those downstream of us?
Data from USGS’ NLDI API provided the flowpath routing data needed for the core of the project, while the Value-Added Attributes from their NHDPlus data provided the official parent feature names for the flowlines making up a river path. Designing an interface to make that data accessible and easy to navigate would be another challenge, though, and that’s where Mapbox came in.
A 3D journey
Instead of just seeing a flowpath plotted on a map, I wanted a user to be able to watch that downstream journey unfold to better appreciate all of the places and topography a raindrop would touch along its way. I had used some of Mapbox’s hill shading features on a previous project, so I knew that getting some sense of the topography, out-of-the-box, would be fairly easy. What I didn’t know, until I started this project, is how powerful and easy to use Mapbox’s 3D features and FreeCamera API have become.
It took just twenty lines of code to add a 3D tile layer to the map, with a gentle sky layer on the horizon:
With that, the base of the visualization was already in place.
The Mapbox FreeCamera API allows fine-tuned control over the camera position, which was necessary for tracing the flowpaths I got back from the calculated USGS data. All I had to do was return USGS data, process it into an array of coordinates and then move the camera from point-to-point along that path until it hit its destination. Simple, right? Not quite, early iterations of the project ended up as incredibly bumpy rides (if you’re prone to motion-sickness, you may not want to click that link). There were a few crucial challenges to overcome to make the tool usable.
Interpolation and smoothing
The FreeCamera API makes positioning and pointing the “camera” in 3D space really simple. Once I had an array of coordinates for a flowpath, I assumed I could simply place the camera at the first coordinate, point it at a coordinate downstream and then advance them forward, using the turfjs along method. Unfortunately, the hooks and bends of the rivers made for a windy disorienting journey.
To address this, I created an artificial, smoothed path for the camera to follow. By averaging together the positions of groups of coordinates, the smaller bends affected the path less. I set the camera to follow this path, while plotting the original, unsmoothed path as a blue line for the viewer to track.
Speed, Pitch, and Zoom
I knew that the speed that the river path ran at would be a challenging balance. No one wants to spend twenty minutes watching the tool run over the lower Mississippi River, but moving too quickly was nausea-inducing. Controlling the rate that the Mapbox camera travelled through flowpath coordinates was simple enough, but the difference between true speed and perceptual speed, impacted by the camera’s elevation and pitch, quickly became clear.
To understand the forces at play, envision yourself in an airplane moving 500 miles per hour. If you’re thousands of feet in the air and staring out at the horizon, you may barely notice how quickly you’re moving. If you’re just above the ground and staring directly downwards, it’ll feel like you’re moving dizzyingly quickly. Both the distance from the ground and the angle you look down at affect your perception of how quickly you’re moving. This is what I had to contend with in finding a balance between speed, camera elevation, and camera pitch.
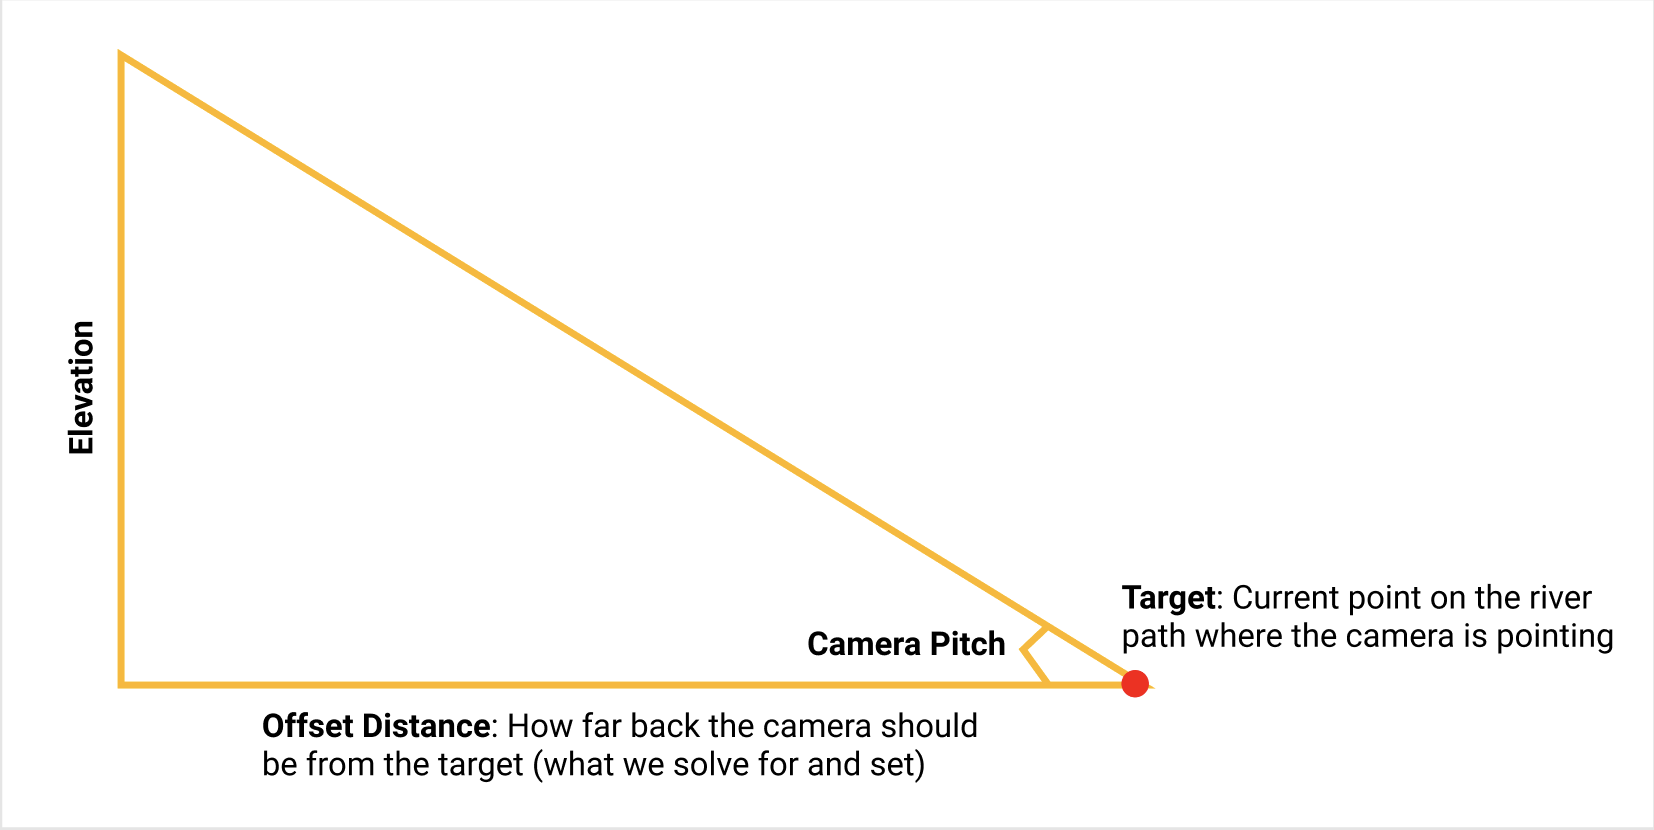
I decided to experiment until I found a camera pitch that made for a comfortable viewing experience (around a 70˚ angle) and a base speed that allowed for reasonably long runs (about 4km per second). Then I adjusted the camera elevation until the perceptual speed felt about right. After dusting off my high school trigonometry textbook, I was able to correctly position the camera back from its target point, using its elevation and pitch.

A consistent source of feedback and tension with the project has been how much control a user is given over the camera on a river run. I was happy to provide playback controls, but I felt that because the interplay between speed, elevation, and pitch affords a user so many opportunities to create a miserable experience, placing some constraints on a user’s control over these factors made sense. I did eventually relent and provide a zoom control of sorts, but it’s pegged to the camera speed to keep the perceptual speed within reasonable bounds. It’s also tied to the coefficient on the path smoother, producing smoother, more approximated paths at higher speeds to avoid nausea.
Elevation
As with many tools, a tradeoff for the increased control over camera positioning is that some of the “magic” under the hood disappears. The ability to set the camera’s elevation manually was crucial to the functionality I wanted to build, but this had an unintended effect as flowpaths weaved down from mountains to sea level: the camera stayed at the same elevation, but the ground got further away.
In order to maintain a consistent distance between the camera and the ground, I sampled elevations along the route using the queryTerrainElevation method. I passed that elevation array to the animate function, which interpolates between sampled elevations and maintains the camera elevation at a set distance above the ground.

Bringing watersheds to life
I’ve heard from a lot of people since launching the project that the concept of watersheds and the interconnectivity of rivers and streams have really clicked for them after seeing flow paths visualized in this way. I hope that understanding watersheds will create more urgency around the protection of waterways and a greater awareness of what gets dumped into them or taken out. Most of us live upstream of a lot of other people.
The project owes a lot to Mapbox, as well as the USGS Water team, and the teams behind Geoconnex and the NLDI API. In particular, I’d like to thank Dave Blodgett at the USGS for all of his help. These same people are doing a lot of work right now to extend the data products I used to create a global River Runner!
Thank you for sharing your innovations, Sam! If you would like to connect with Sam about River Runner or other projects, get in touch.
If you are building tools for science communication, environmental protection, or other positive impacts - connect with our Community team. And get started with Mapbox 3D terrain today in just one click.


