How Maps are Used in the Weather Industry
Heading
Lorem ipsum dolor sit amet, consectetur adipiscing elit, sed do eiusmod tempor incididunt ut labore et dolore magna aliqua.

The weather industry relies heavily on accurate and up-to-date mapping solutions to provide weather information, forecasts, and warnings to the public. However, organizations often run into challenges when creating weather visualizations for users. Without accurate, adaptable, and easily accessible maps, weather companies fall behind competitors that offer a better user experience.
Mapbox Weather uses best-in-class maps and powerful developer tools to provide solutions to the top challenges facing the weather industry. By integrating products such as Mapbox Tiling Service and Maps SDKs into their applications, companies can deliver incredible results that earn them long term customer loyalty.
Mapping Solutions In The Weather Industry
There are a variety of tools and technologies available that allow meteorologists to visualize and analyze complex weather data, track weather patterns, and create accurate weather forecasts. The weather industry uses all of these methods when providing customers with meteorological visualizations of both the present and the future.
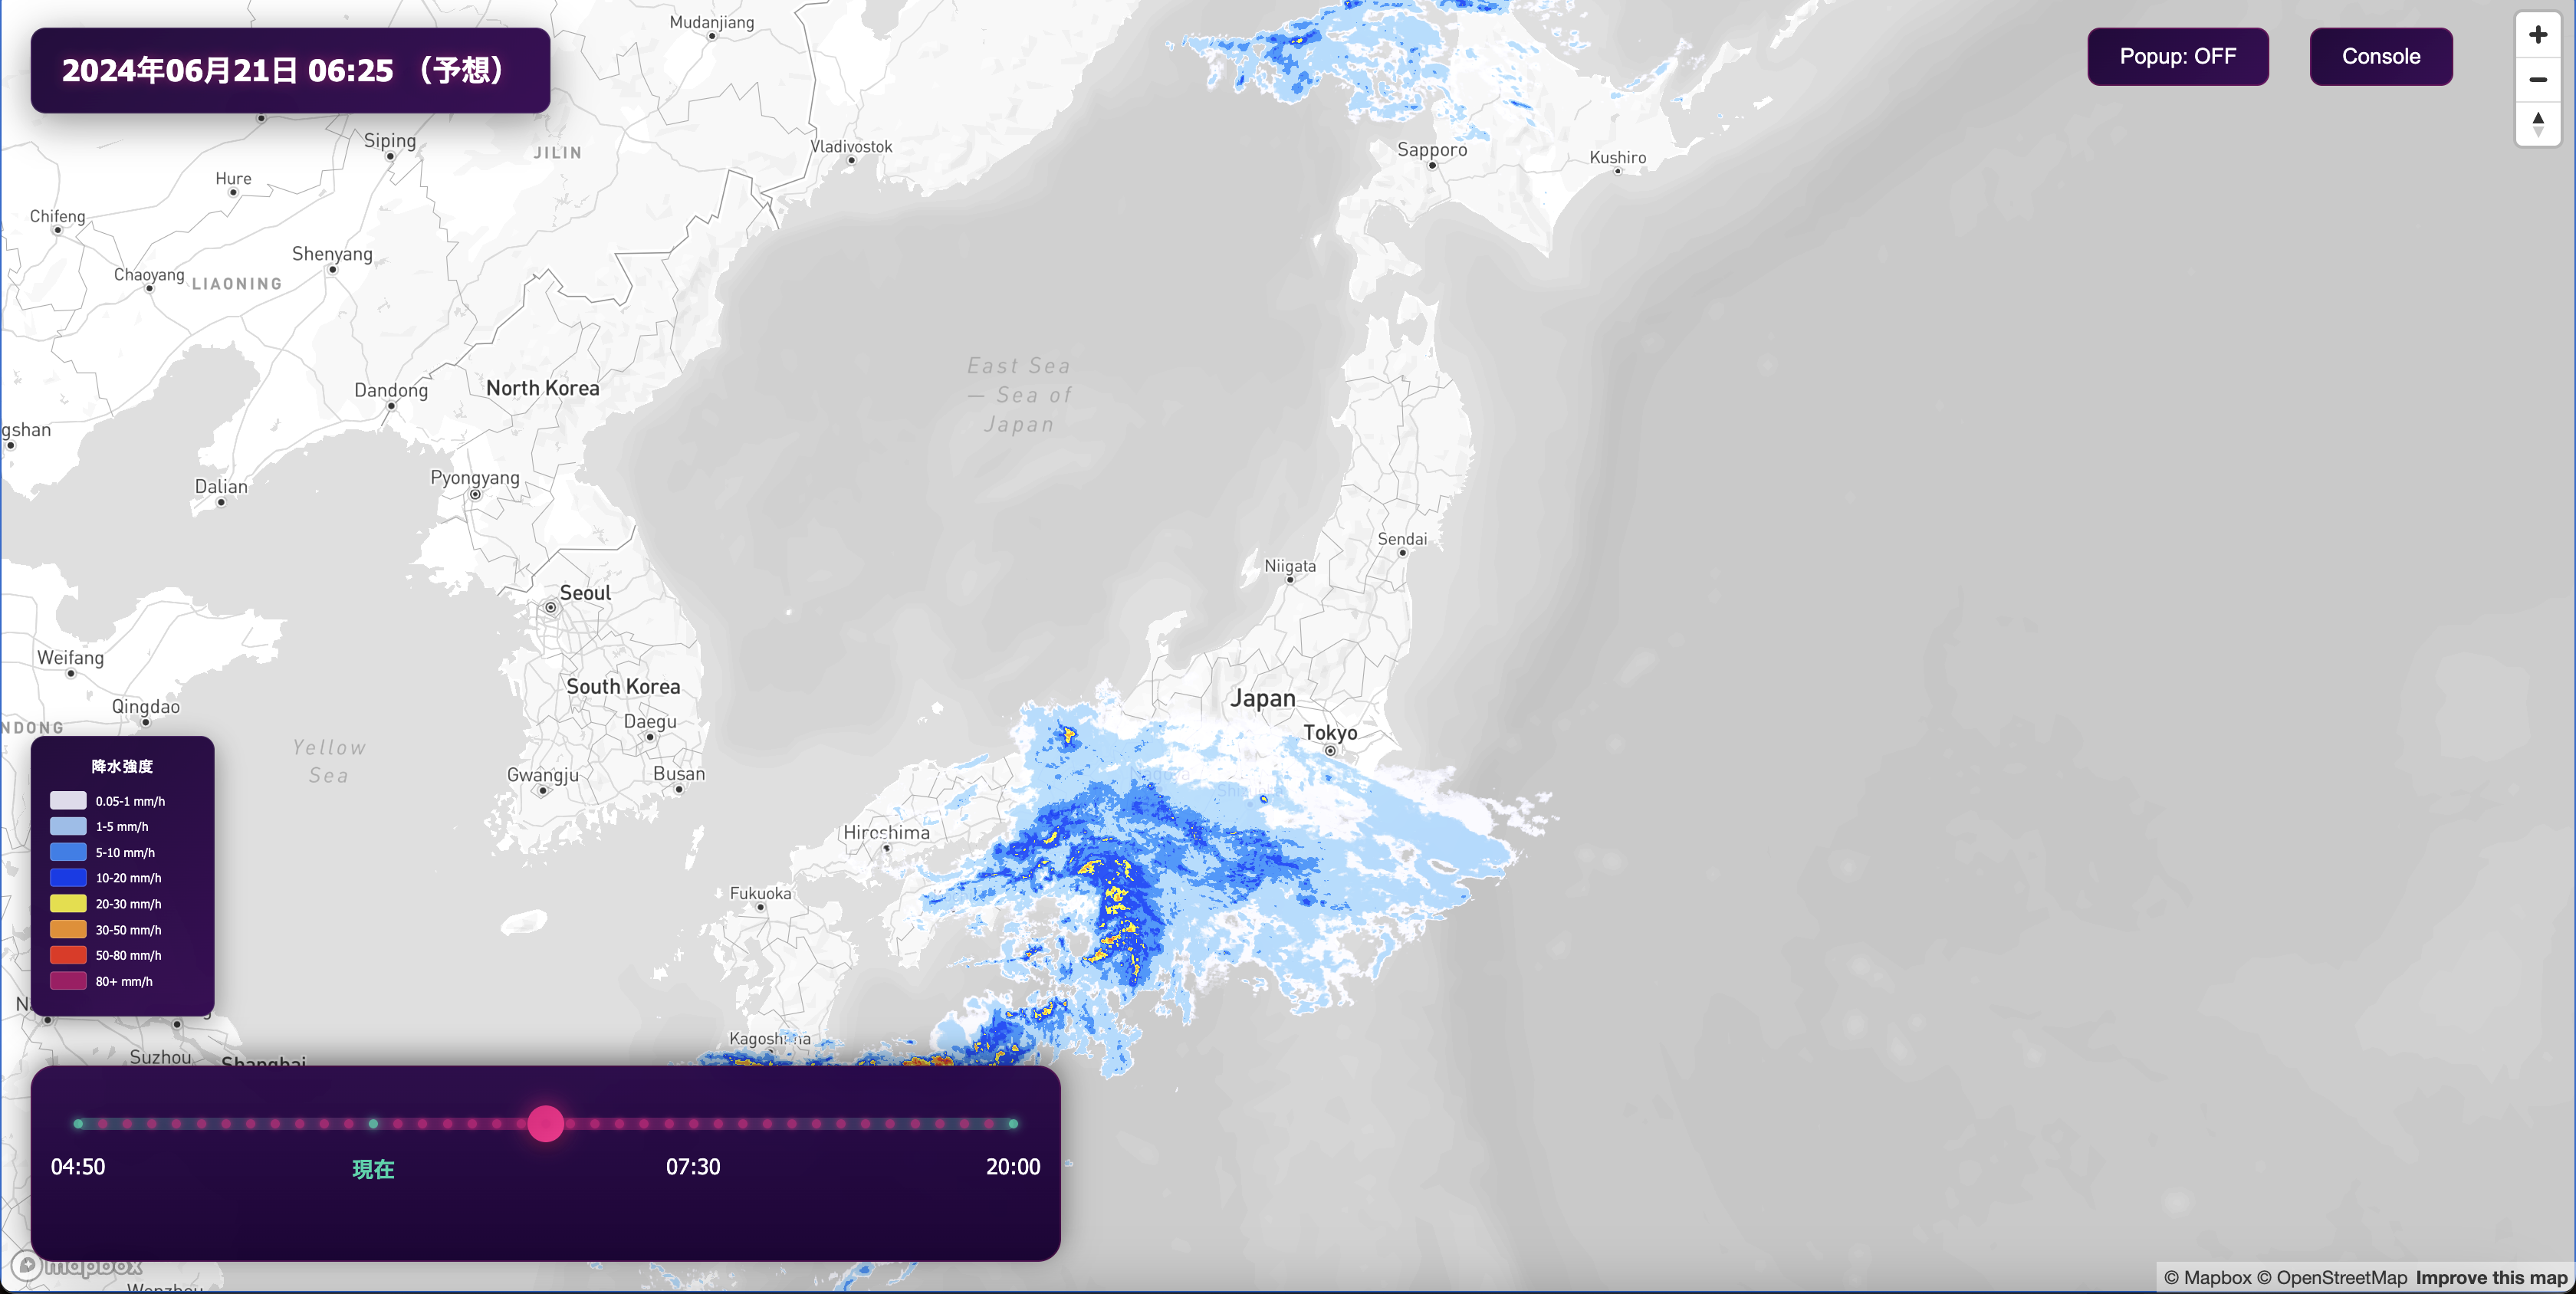
Weather Radar — Weather radar is an instrument that detects and identifies various types of precipitation. Raw radar images are displayed on maps to warn viewers of incoming changes in conditions.
Satellite Imagery — These images can be used to create detailed maps of weather systems and to predict future weather patterns.
Computer Models — Computer models use a combination of data from radar, satellite, and other sources to simulate the behavior of the atmosphere and predict the movement of storm systems.
Weather Stations — Weather stations often include instrumentation that measures temperature, humidity, wind, and other elements that help paint a clearer picture of the world outside.
However, there are challenges that stand in the way of seamless weather mapping.

Weather Mapping Challenges and Mapbox Solutions
There are three main challenges for weather organizations and companies seeking to improve their mapping products and build their user base: variety of visualization, weather awareness, and user accessibility.
Variety of Visualization
Variety is key when creating maps that successfully provide all the information that users want when they want it. Maps must work flawlessly regardless of the map type, the data, and the platform.
Why is it challenging to visualize data on maps?
Oftentimes, companies have more data than can be displayed on a single map, and the way the data is presented feels disjointed and inconsistent. Users may find that when they switch from a basemap to a globe view, or from a temperature map to a radar map, the visualization becomes incoherent. They may find that their experience on a mobile app pales in comparison to their experience on the same company’s web-based platform. The mapping challenge here comes down to two words: variety and consistency.
Visualizing with Mapbox
Using Mapbox tools, companies can build data-driven interactive visualizations layered on Mapbox basemaps for radar, satellite data, temperature, and more. Plus, customers can visualize weather on a 3D globe view of the world, or on a 3D base map. Each map is customizable using Mapbox Studio, where businesses can design maps that provide a consistent and intuitive user experience while reflecting the company’s brand image.
Mapbox’s work with AccuWeather showcases how the Maps SDK was used to streamline the company’s development cycles, leading to incredible cross-platform functionality. AccuWeather was able to revamp its maps to provide a more cohesive brand experience for consumer and enterprise users across all key platforms including web, iOS, Android, and AccuWeather Enterprise Solutions.

User Safety and Weather awareness
Weather changes at the drop of a hat. To keep users safe, weather maps must reflect real-time changes instantaneously.
Why do maps need accurate weather data?
Most people have had the experience of seeing clear skies on their weather app or website, only to step outside and find themselves sprinkled with rain. While this is a slight inconvenience, the problem becomes more serious when considering life-threatening inclement weather. If mapping platforms are not updating quickly and consistently, users may find themselves caught in dangerous situations such as flash floods, blizzards, or thunderstorms.
Weather awareness with Mapbox
Using Mapbox, organizations can deliver weather information based on large and diverse datasets quickly and reliably, increasing user safety by improving weather awareness. Updates are seamless using industry-leading rendering engines and tiling service pipelines to update large amounts of imported data in near real-time.
Mapbox worked with Plume Labs to help its users avoid air pollution. Using Mapbox Tiling Service, Plume scientists were able to update the entire world's air pollution data in real time so that their users could avoid pollution hotspots while they walk, run, or cycle through their city. Air quality information can be delivered via map, or via live air quality alerts.

User Accessibility and Experience
A company may have the best weather data in the industry — but if nobody uses their platform, what good is it? Weather-based applications must focus on growing their user base and keeping those users engaged.
Why do users disengage from weather apps?
Weather maps can sometimes be bland, boring, and unremarkable. Plus, a lack of cross-platform functionality, shareable content, and relevant alerts leads to low levels of engagement. Users don’t recognize weather-based brands the way they do with brands in other industries. Because of this, it’s a tough challenge for weather apps to grow their user base.
Engaging Weather Solutions with Mapbox
Using Mapbox tools, companies can design accurate, engaging, and branded weather and warning maps that are instantly recognizable. This allows businesses to create a community around the brand, similar to outdoor communities like Strava and Fishbrain. Brands can quickly create lightweight static maps from their interactive maps, share them across their social channels, and link them back to their interactive maps, piquing user interest and engaging their curiosity.
The maps are fully customizable using Mapbox Studio — beautiful, performant, interactive, and as unique as the designer wants them to be. Notifications, alerts, and warnings can also be issued with users in mind — providing relevant information that is sure to enhance the user experience.
Whatever the Weather, Use Mapbox
Quality mapping is the best way for the weather industry to communicate meteorological information to their customers. With top-tier products and services such as Mapbox Tiling Service, Mapbox Studio, and Mobile Maps SDK, Mapbox can help any company rise to the next level. Rain or shine, Mapbox has you covered.
Get started today with Mapbox Weather.
Lorem ipsum dolor sit amet, consectetur adipiscing elit, sed do eiusmod tempor incididunt ut labore et dolore magna aliqua.


